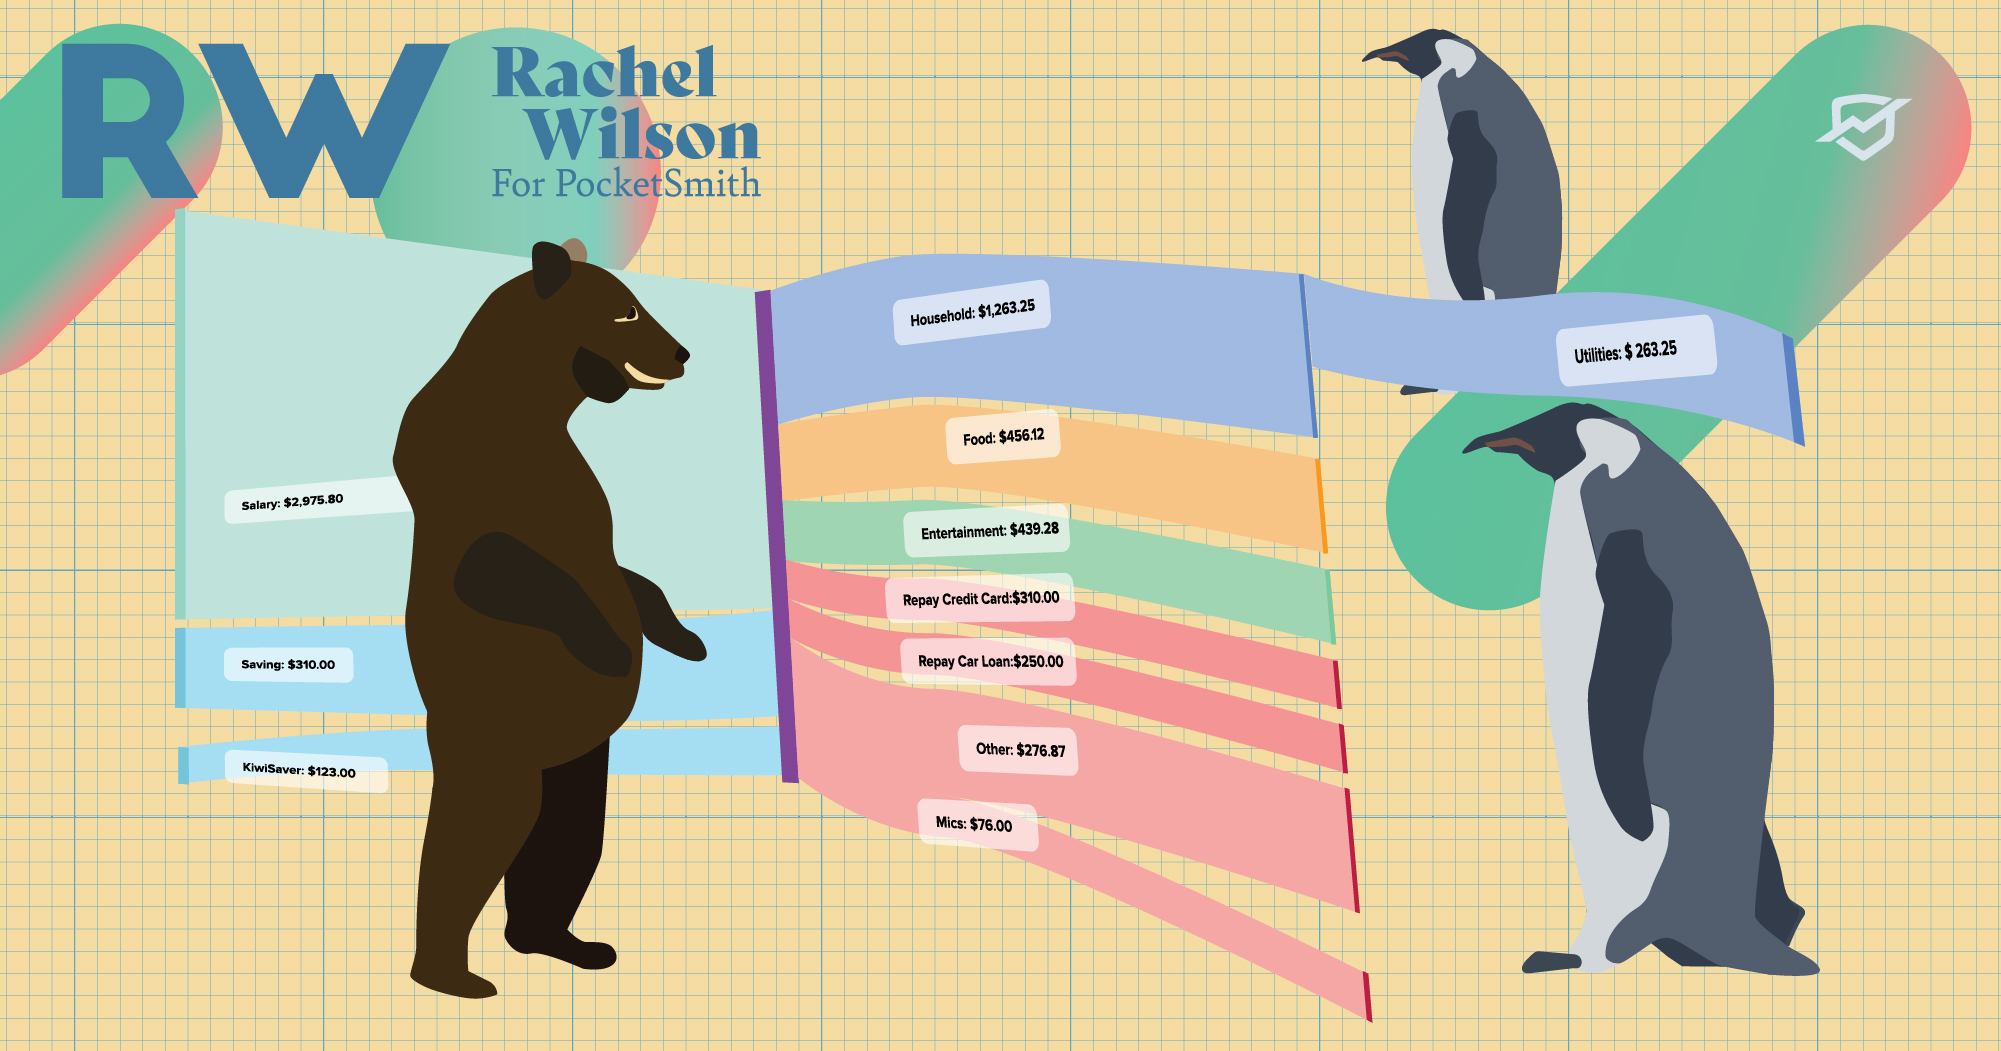
A few months back, I made a fascinating discovery. I was browsing through the PocketSmith Pals Facebook group (a great place to ask all questions PocketSmith-related and chat with other users), when I stumbled across a thread about a new feature — the Sankey widget.
Quiz time!
Is a ‘Sankey’:
Okay, if you read the title of this post, you’ll know the answer. A Sankey is, indeed, a type of flow diagram — specifically, one where the width of the flow is proportional to its quantity.
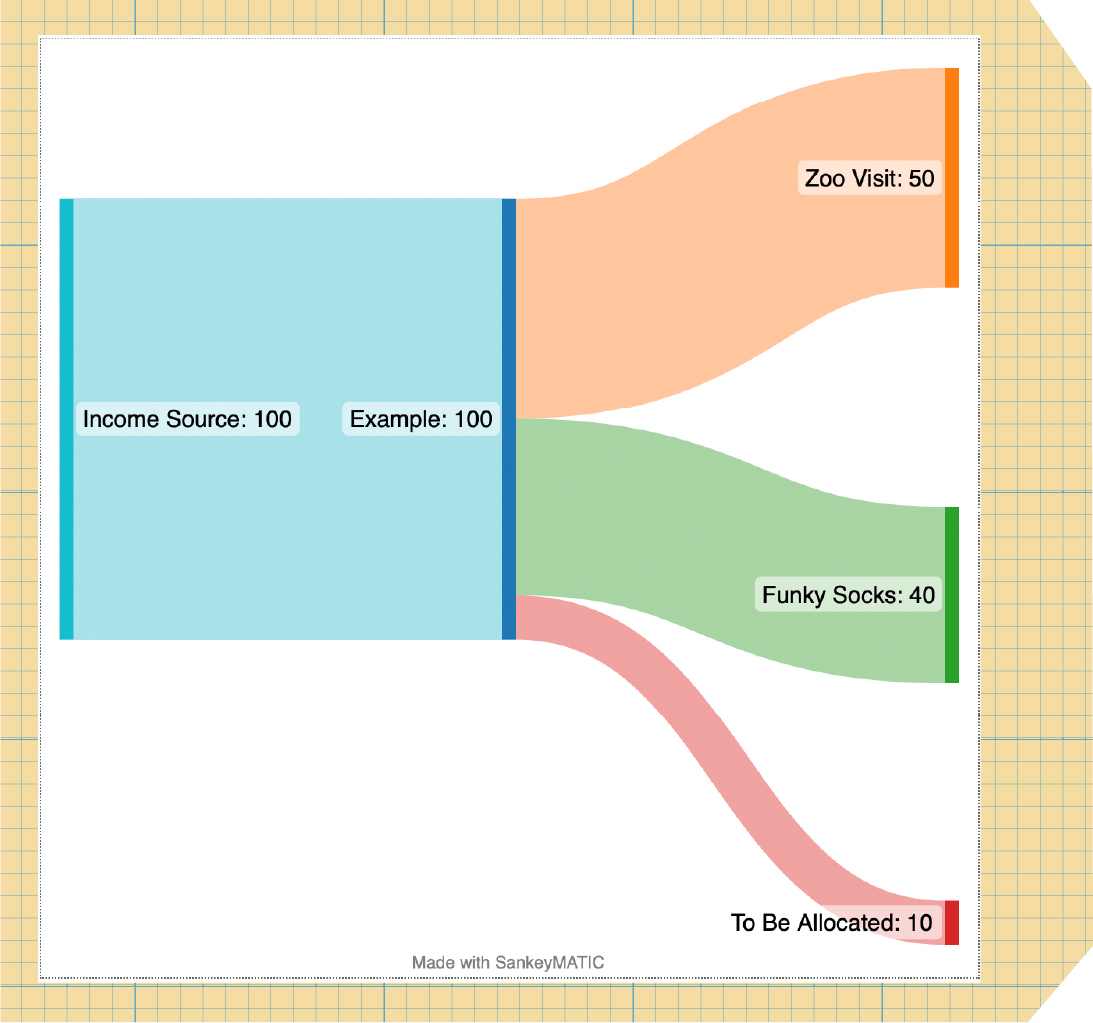
Start with $100. This takes up 100% of the starting flow.
Allocate $50 to, say, a zoo visit to see the giraffes. Because $50 is 50% of your starting value, the arrow will then, proportionately, take up 50% of the flow width.

To put it another way, it’s like New Zealand’s famous braided rivers. Water starts at the source (100%), flows down through various streams (100% split between as many streams as you’d like), and eventually flows out to sea (still 100%, but by now much more dispersed).
Zoo visits, braided rivers, got it.
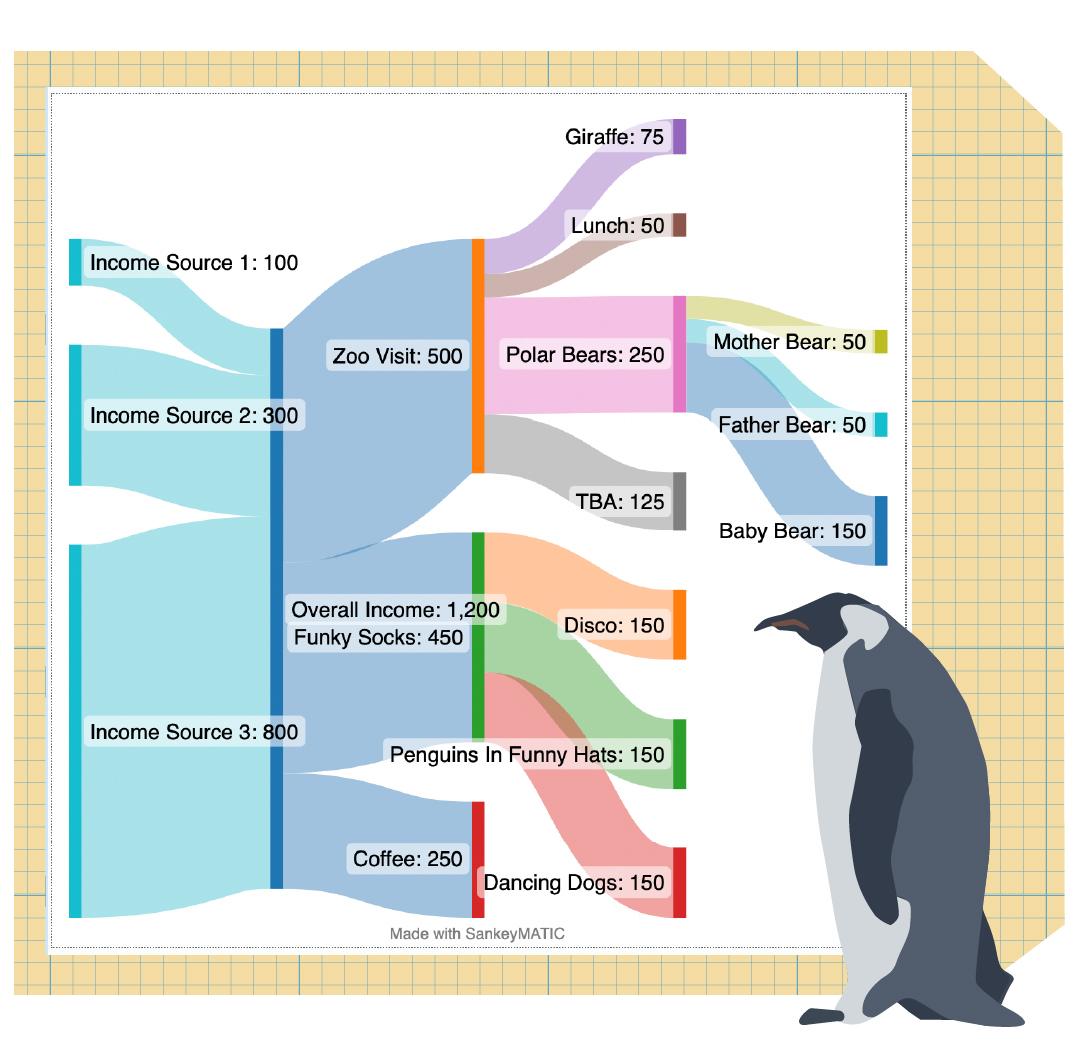
The beauty of the Sankey is that it lets you see everything at a glance. You can add multiple income sources and see your big earners. You can allocate spending flows to a dozen streams and watch them leap over waterfalls. It can be as simple or as complex as you’d like.

Now, I used to run a Sankey diagram manually. It wasn’t a constant thing: More of an occasional gut check for myself, to make sure that my spending was on track and I wasn’t running too close to the line. Once or twice a year, I would sit down at my computer, pull up my budget spreadsheet, go to sankeymatic.com, and enter my spending for each category into the diagram flows.
Yep. That’s right. Manually.
One category at a time. Income sources. Sub-income sources. Parent categories. Child categories. Grand-categories. All of them, painstakingly entered one keystroke at a time.
Let’s just say there’s a reason I only did it a few times a year.
Then I would sit back and take it all in. It’s all very well having the data visualization there, but it’s not worth much if I don’t apply it. So I’d ask myself the hard questions.
And then, having asked and answered the hard questions, I would apply them.
The great thing about PocketSmith’s Sankey widget? It’s automatic.
No manual entries. No frustrated math checks when the numbers don’t add up. It’s all there, ready for you to visualize your money flow from mountain to sea.

Maybe you need to add another water source. Maybe you have too many identical creeks, and it’s time to merge some of them together. Maybe there’s one waterfall you haven’t been looking at because it’s too scary, but when you take a breath and take the plunge… hey, that wasn’t so bad.
You won’t know until you look. So what are you waiting for?
Rachel E. Wilson is an author and freelance writer based in New Zealand. She has been, variously, administrator at an ESOL non-profit, transcriber for a historian, and technical document controller at a french fry factory. She has a keen interest in financial literacy and design, and a growing collection of houseplants (pun intended).